|
A Prince & Prince Market Report Historical Downward Trend in Consumer Floral Purchasing for Valentine’s Day: A "Wake-Up" Call for the Industry? Insight
from the 2014 Prince & Prince U.S.
Consumer Floral Tracking Survey Dr. Thomas L. Prince Dr. Timothy A. Prince Prince & Prince, Inc. Columbus, OH USA Release Date: Jan. 5th, 2015 |
|
EXECUTIVE SUMMARY
|
|
Historical Downward Trend in Consumer Floral Purchasing for Valentine’s Day: A "Wake-Up" Call for the Industry? Insight from the 2014 Prince & Prince U.S. Consumer Floral Tracking Survey Drs. Tom & Tim Prince, Prince & Prince, Inc., Columbus, OH USA Special Note: This report is based on new consumer research findings excerpted from the Prince & Prince (P&P) consumer floral seminar, "The U.S. Consumer Floral Tracking Survey, 2014 Edition". The Valentine’s Day purchasing metric is just one of over 100 floral-purchasing metrics highlighted in the P&P seminar. The consumer research update was sponsored by Smithers-Oasis North America (SONA). P&P sincerely thank SONA for their support in making this market research update possible, providing benefit for the entire floral industry. The updated P&P consumer floral research is now available to the floral industry with an on-site seminar format, including Q&A session. Please contact P&P for seminar content, fees, & scheduling. In this exclusive reporting, Prince & Prince (P&P) show recent and historical trends in consumer household floral purchasing for Valentine’s Day, dating back to 1996, and up to 2013. Valentine’s Day, a $2.9 billion dollar "floral holiday" at retail in the U.S., is one of over 20 holidays, occasions, and events of floral purchasing tracked by P&P with their periodic surveys of the U.S. floral-buying consumer market (Prince & Prince, 2012a, 2012b. 2013, 2014b, 2014c). The purchasing data, prior to and after the 2008 U.S. recession, not only reveals how the recession has impacted consumer floral purchasing for Valentine’s Day, but the historical data also reveals long-term trends in consumer purchasing behavior for this holiday. Additionally, P&P’s segmentation of each study’s overall survey findings by consumer demographics reveals key consumer groups that drive floral purchasing for Valentine’s Day. A fuller understanding of these historical consumer-purchasing trends for Valentine’s Day will likely assist the floral industry in fully exploiting all the market potential that this holiday has to offer. Household Purchasing for Valentine’s Day was Lower in 2013 Figure 1 shows the incidence of household floral purchasing for Valentine’s Day across the past five P&P survey periods: 1996, 2000, 2007, 2010, and 2013. By household purchasing incidence, P&P means the purchase of one or more floral products (fresh cut flowers and/ or indoor potted plants) by the household for Valentine Day during the specific study year. P&P shows the purchasing incidence as the percentage of floral-buying households that made a floral purchase for Valentine’s Day for each survey period. For 2013, 49 percent of floral-buying households in the U.S. purchased floral for Valentine’s Day (Thursday of the week), down three percentage points since Valentine’s Day of 2010 (Sunday of the week), and the lowest purchasing incidence since P&P’s initial consumer floral survey in 1996 (53%; Wed. of the week).
Recession and Recovery The impact of the 2008 U.S. recession on household Valentine’s Day floral purchasing shows generally downward trends. Although P&P did not conduct nationwide consumer floral surveys during the depth of the recession in 2008 and 2009, the total number of U.S. floral-buying households was still down about 10% in 2010, compared to before the recession (2007). However, the percentage of those floral-buying households purchasing specifically for Valentine’s Day in 2010 was relatively strong, 52% (Prince & Prince, 2012a). P&P’s analysis of households’ floral spending metrics suggested that average floral dollar spending by households for Valentine’s Day in 2010 was about 20% lower than the spending level prior to the recession (2007). For the "recovery period" of 2013, the P&P estimate of average household floral spending "attributable to Valentine’s Day" was $74, including all household members making a floral purchase, and with associated delivery/ service fees included. This household floral spending level was $7 higher than the average in 2010 ($67), yet still $10 lower than in the period prior to the recession (2007; $84). However, the volatility in floral dollar spending by the household for Valentine’s Day is also indicative of the major channel shifts in consumer floral purchasing prior to and since the recession, channel shifts detailed in the P&P Consumer Floral Seminar (Prince & Prince, 2014c). Long-Term Trend for Valentine’s Day Purchasing is also Down Slightly The 49 percent purchasing incidence among U.S. floral-buying households in 2013 (Figure 1) means that an estimated 39 million households had purchased floral products for Valentine’s Day in 2013, similar to the number of households that purchased in 2010. In fact, the purchase percentage trend across the five survey periods suggests a slightly downward trend, as depicted in Figure 2. P&P conducted statistical trend analysis on the Valentine’s Day purchasing data across the five survey years using pre-planned, single degree-of-freedom orthogonal contrasts (MANOVA program in SPSS Advanced Models; Anon. 1999), and P&P is 75% confident that the slight downward linear trend is real, and not due to chance. Although P&P’s level of confidence in this finding is lower than P&P’s traditional 90% confidence level in most reporting, across the 17-year time horizon, three of the four period to period trends also were down (up only for 2010).
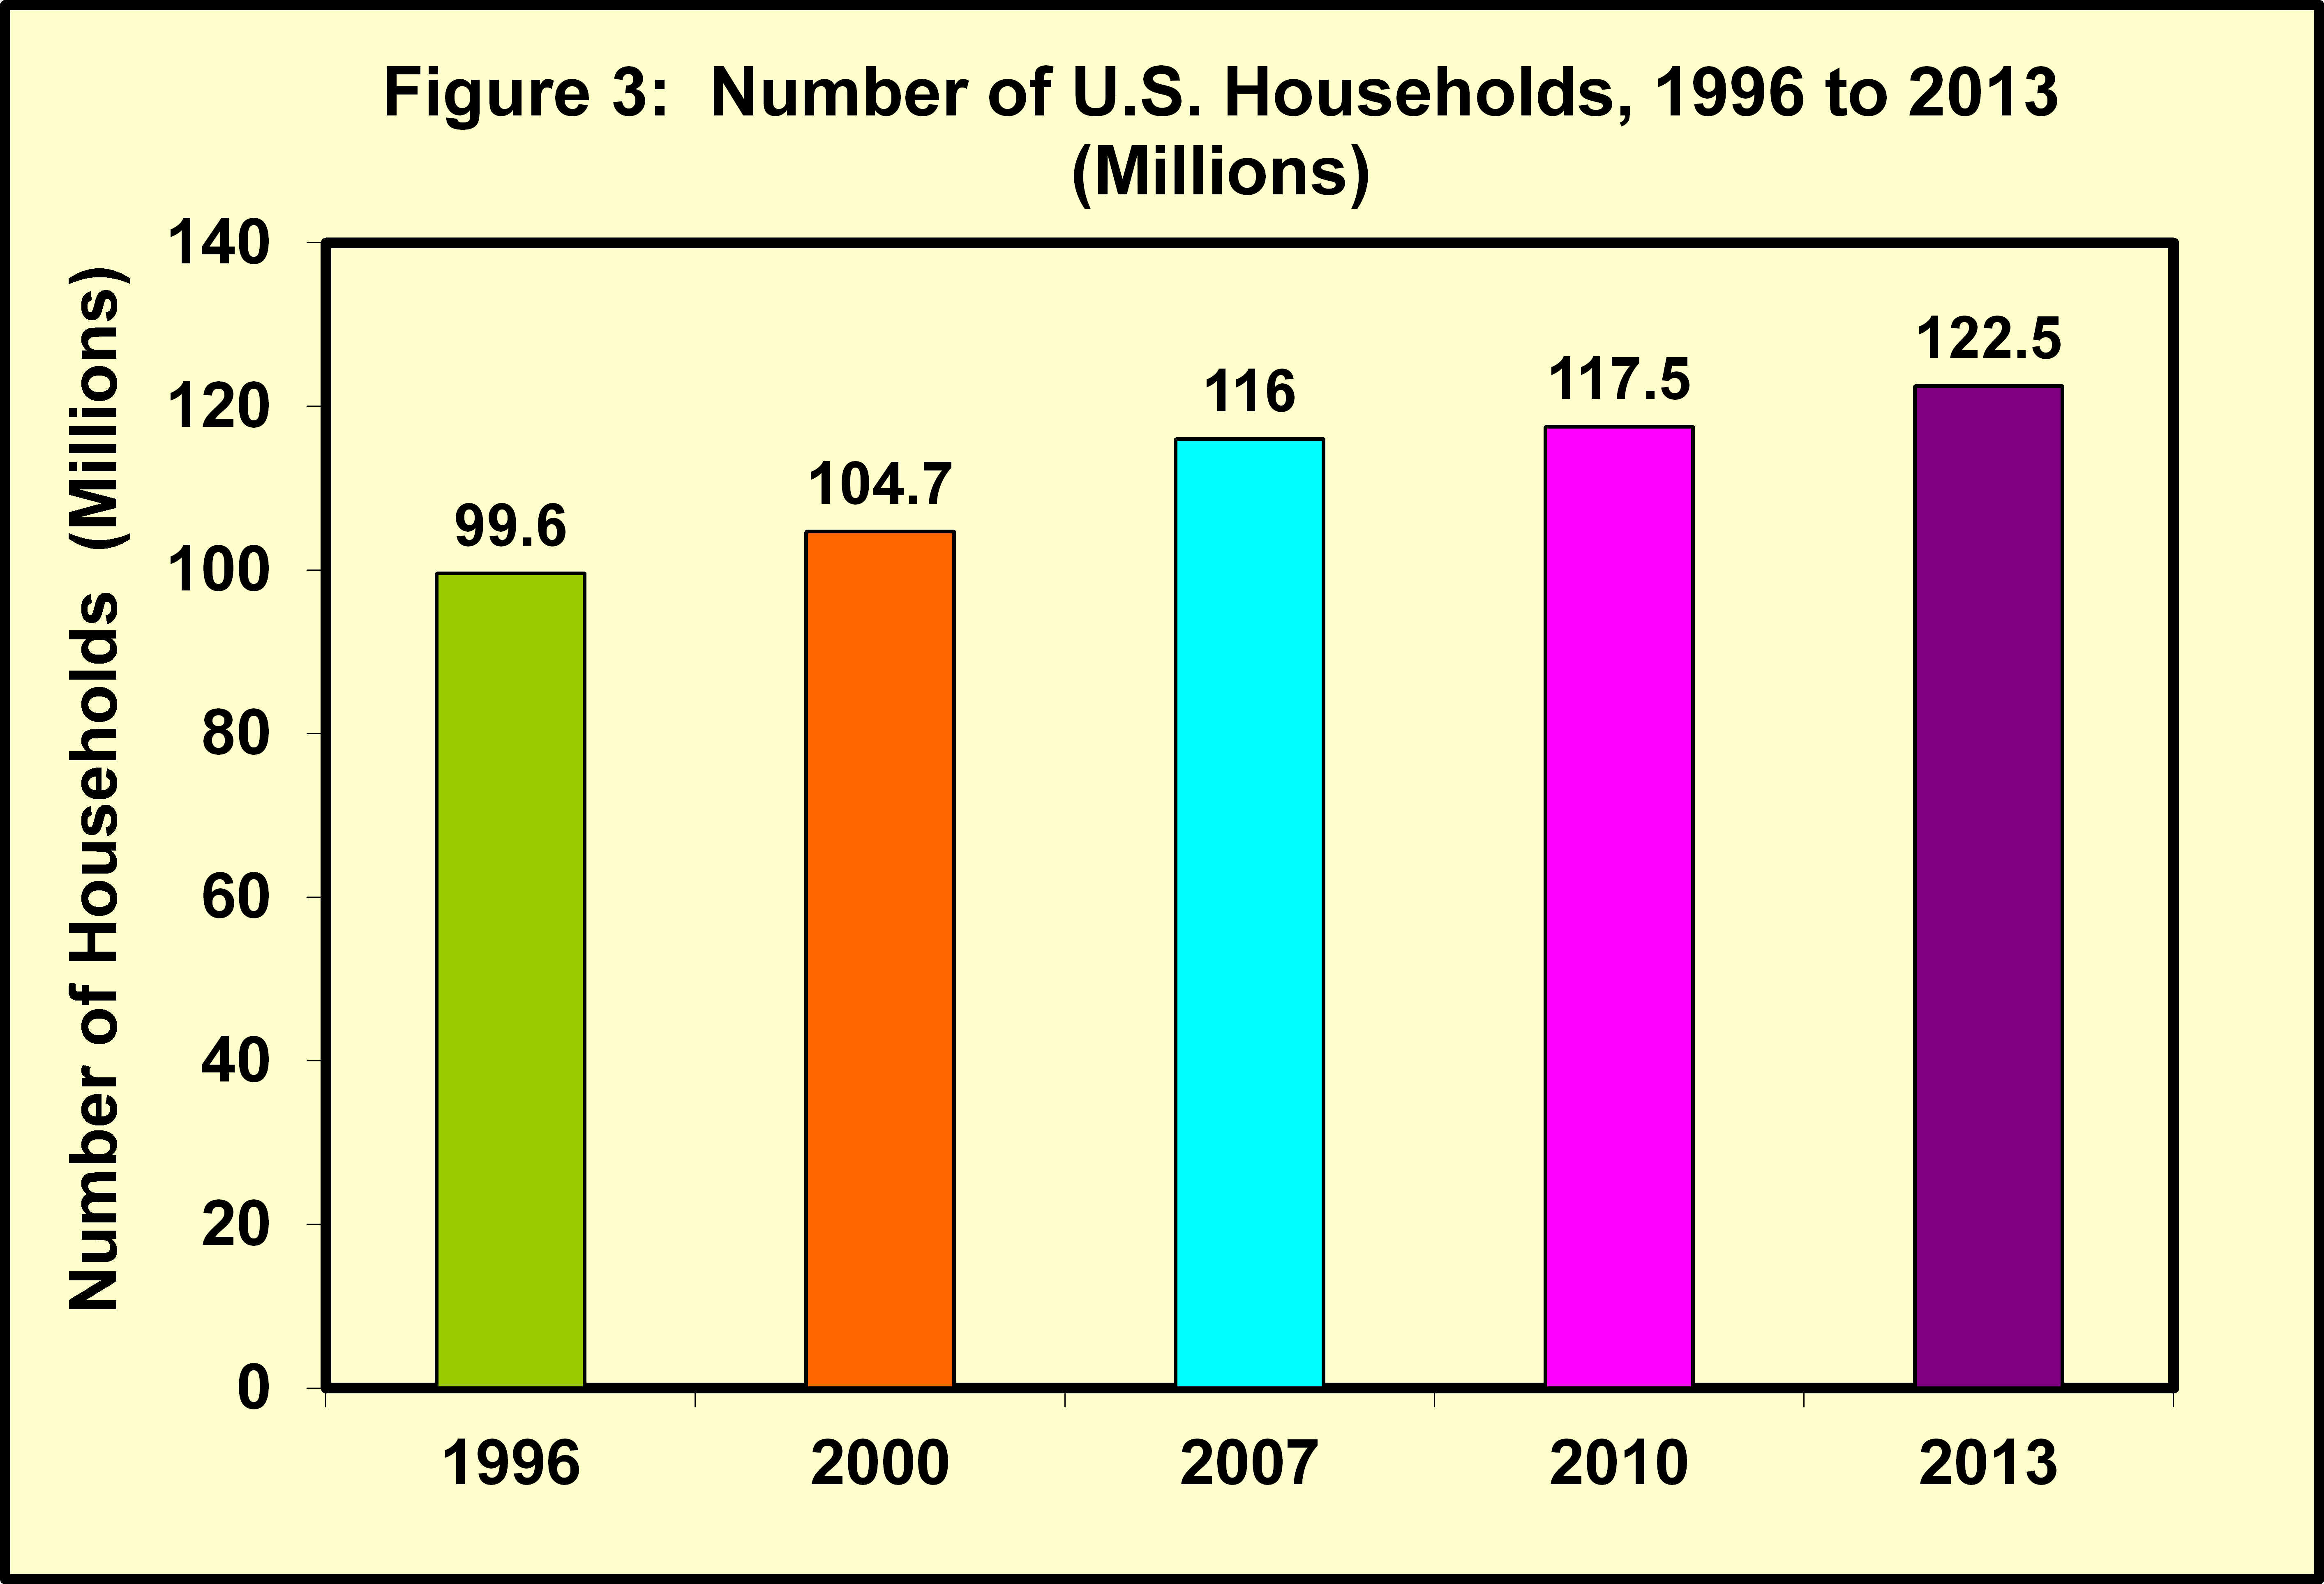
The "outlier" up-tick in 2010 may relate to the holiday falling on the week-end, with mass-marketers likely capturing "late" Valentine’s Day floral sales during week-end shopping (note that average household dollar spending for Valentine’s Day in 2010 also was lower, indicative of more mass-market floral sales). Collectively, the P&P consumer data indicate a slight downward trend in household floral purchasing for Valentines Day since 1996. U.S. Annual Household Growth Masks Declining Valentine’s Day Trend P&P suggests that members of the U.S. floral industry are largely unaware of this long-term declining trend in consumer floral purchasing for Valentine’s Day due to several factors. For one, the level of household floral purchasing for Valentine’s Day is currently relatively high, ranking third highest among all holidays and occasions surveyed by P&P (bested by Mother’s Day, and year-round birthday gifting), thus small percentage changes from a high level are likely more difficult to assess, from time period to time period. Another and likely more important factor is that the number of households has continued to grow in the U.S., albeit slowly over time, even through the recession years. This household growth bolsters the size of the U.S. floral market over time, which masks the decline in the incidence of floral purchasing for Valentine’s Day. Figure 3 shows the rate of growth of U.S. households over the P&P consumer survey periods. In the survey periods prior to the U.S. recession (2007 & prior years), the U.S. household growth rate was averaging about 1.5% annually. After 2007 (the recession years), the average household growth rate had slowed to just under 1% (about 0.9%), yet still increasing annually, on average. Thus, with U.S. household growth rates around 1% to 1.5% annually, that level of household growth largely mask the very small annual percentage decline in household incidence of floral purchasing for Valentine’s Day, e.g. the holiday purchasing percentage is declining slightly, but the whole household "market pie" is getting larger at a slightly higher rate. Since 1996, the number of U.S. households has increased 22%, while the incidence of household floral purchasing for Valentines Day has declined four percentage points over that same time period. P&P estimates that in 1996, 37.5 million U.S. households purchased floral products for Valentine’s Day, and in 2013, that estimate was up to 39 million households, even with the lower incidence of purchasing floral for the holiday in 2013. And this analysis does not take into account annual price increases in Valentine’s Day floral products and services that would have likely occurred over the past 17 years, further bolstering Valentine’s Day floral sales estimates over time.
Reasons for the Decline in Valentine’s Day Floral Purchasing There are likely several reasons for the decline in the household incidence of floral purchasing for Valentine’s Day, and P&P offers a few to ponder. Aside from "weather conditions" associated with consumer purchasing for Valentine’s Day (and with implications for the entire floral channel), the general increase in competitive non-floral products in the retail marketplace for traditional floral holidays, such as Valentine’s Day, is likely a reason for the decline. Candy, wine/ bourbon, jewelry, intimate apparel, i - anything, and fine dining options compete increasingly with floral for consumers’ discretionary dollars at Valentine’s Day. Other industries are largely targeting Valentine’s Day as another key sales opportunity. It is also possible, in this milieu of competitive offerings, that the floral industry’s advertising and promotional messages for Valentine’s Day are less effective now, than they were a decade or so ago. The possible lack of clear, consistent, and effective industry advertising at Valentine’s Day over the decades (e.g. one voice), due to the decline in large-scale national advertising for floral at the holidays (remember the national wire service TV ads?), and a focus on more individual business advertising, Internet advertising, and social media may also be a reason for the Valentine’s Day purchasing decline. While some individual floral businesses may largely benefit from this new advertising/ promotional model, the broader floral industry may not fare so well, especially during the holidays (Prince & Prince, 2014a, florist report on social media). Recent large-scale failures in timely delivery of Valentine’s Day and other holiday floral products to consumers among key wire services and "order gatherer" operations are concerns for future consumer floral purchasing, and may forever dampen consumers’ purchase likelihood for floral. How those offenses are handled to the satisfaction of the purchasers and floral recipients is key to the retention of customers, and the probability of increasing floral-purchase likelihood going forward. Another factor is that the floral industry, and especially the production side of the industry, is sometimes ambivalent to expanding resources for Valentine’s Day, a "single-day" holiday that the industry perceives as having relatively strong consumer demand. Sectors of the floral industry would rather focus on building more "everyday" consumer floral sales, thus smoothing consumer demand throughout the year. Notwithstanding, the floral industry could likely do more to defend its market position at Valentine’s Day as the premier product category that best expresses human emotions of love and affection, the hallmark message of Valentine’s Day! If no change occurs, it is likely that the U.S. household incidence of floral purchasing for Valentine’s Day will continue on its very slow, yet steady decline, as it has for nearly two decades. The P&P seminar highlights a few other key floral holidays/ occasions, in addition to Valentine’s Day, which show similar long-term downward trends. P&P considers these long-term purchasing trends to be troubling, and represent a "wake-up" call for the floral industry. Key Consumer Demographics Drive Valentine’s Day Floral Purchasing While the overall long-term trend in household floral purchasing for Valentine’s Day is down slightly, there are several key consumer segments that are "bucking" that long-term trend, and are increasing their purchasing of floral products for Valentine’s Day. In P&P’s consumer floral survey, ten demographic characteristics of the floral-buying households are captured and analyzed (Table 1). In prior reporting, P&P has highlighted consumer age, and presence of teenagers within the household, as two key demographics that drive floral purchasing for this holiday (Prince & Prince, 2012a). In this reporting, P&P updates those two key demographics from the 2013 survey. The P&P Consumer Floral Seminar reviews all the key consumer demographic trends over time that have a positive and negative impact on consumer floral purchasing for Valentine’s Day, and for the other 20+ holidays, events, and occasions of floral purchasing measured in the P&P survey.
Younger Consumers Lead Floral Purchasing Trends Valentine’s Day floral purchasing varies significantly by age of householder, and younger-aged consumers under the age of 35 show an increasingly higher incidence of floral purchase for this holiday (63% in 2013), compared to other age groups (Figure 4). Compared to the 2010 survey, floral purchasing for Valentine’s Day in 2013 trended higher for both of the youngest consumer groups (age under 35, and 35 to 44), and trended somewhat lower for those consumers aged 45 and older. Collectively, these survey findings exemplify the fact that Valentine’s Day is one of the key holidays for the industry to target young consumers, and likely new floral buyers, with fresh floral products. These findings also highlight the need for a broader range of "age-appropriate" floral products for Valentine’s Day that capture the allure and interest of younger consumers, as well as middle-age consumers (likely different floral products).
Teenagers within the Household Expand Floral Purchasing As was shown in all prior P&P consumer surveys since the "teenager metric" was first measured by P&P in 2000, the presence of teenagers within the household in 2013 again has an impact on expanding household floral purchasing for Valentine’s Day (Figure 5). For 2013, more than one-fifth (21%) of all floral-buying households reported teenagers within the household. For floral-buying households without teenagers, Valentine’s Day purchase likelihood was 48% in 2013. However, with teenagers present, the floral purchase likelihood jumps ten percentage points to 58%. This sizable increase in Valentine’s Day floral purchasing attributable to teenagers has been largely maintained through the recession. This durable purchasing trend again exemplifies the importance of broadening the Valentine’s Day floral offerings with more age-appropriate floral products that also include the "teenage years", thus expanding upon the demand trends revealed with the householder age findings.
U.S. Floral Market Prediction for Valentine’s Day 2015 P&P rarely make public predictions from their survey data regarding future outcomes, since there are so many uncontrollable factors that can affect these outcomes, but P&P are often asked to make predictions during seminar presentations. With the recovering economy in full swing currently in the U.S., the overall level of household participation in the floral market (e.g. households making at least one floral purchase annually) should rise to pre-recession levels shortly, thus buttressing the overall household size of the floral market (household participation). The annual rate of household growth in the U.S. may also rise to pre-recession levels over time (about 1.5%, up from 0.9%), furthering the expansion of the floral market in the U.S. The precise timing of these movements, however, is in question. In P&P’s view, many of the factors that affect the incidence of floral purchase for Valentine’s Day have not changed much since 2013. However, the upcoming holiday falls on Saturday, which likely increases the 2015 household incidence of floral purchasing (via mass-market outlets), but at a lower average unit sale price. Thus, P&P predicts a 52% household floral purchasing incidence for Valentine’s Day 2015. Overall, P&P predicts a $3.2 billion dollar floral market for Valentine’s Day 2015, up about 10% from the 2013 estimate. But the market expansion will largely come from the general recovery of the U.S. economy, and not from the floral industry’s deeper penetration of the consumer market at Valentine’s Day. Prince & Prince appreciates comments on this report from the floral industry.
Literature Cited Anon. 1999. SPSS® 10.0 (Statistical Package for the Social Sciences) Syntax Reference Guide for SPSS Base, SPSS Regression Models, and SPSS Advanced Models. Chicago, IL: SPSS Inc. Prince, T.L. and Prince, T.A. (2012a). Trends in Consumer Floral Purchasing for Valentine’s Day in a Post-Recessionary Economy. Columbus, OH: Prince & Prince, Inc. Prince, T.L. and Prince, T.A. (2012b). Consumer Floral Usage for "Home Decoration" Slumps in Recession, But Consumer Demographic Trends Signal a Re-Bound. Columbus, OH: Prince & Prince, Inc.. Prince, T.L. and Prince, T.A. (2013). Consumer Demographic Trends Lift Floral Purchasing for Easter. Columbus, OH: Prince & Prince, Inc. Prince, T.L. and Prince, T.A. (2014a). Florists Broadly Adopt Social Media, Payoff Somewhat Nil, Now What? Columbus, OH: Prince & Prince, Inc. Prince, T.L. and Prince, T.A. (2014b). U.S. Consumer Floral Purchasing for Proms & Dances Rebounds from Recession. Columbus, OH: Prince & Prince, Inc. Prince, T.L. and Prince, T.A. (2014c). The Prince & Prince U.S. Consumer Floral Tracking Survey, 2014 Edition. Columbus, OH: Prince & Prince, Inc (On-Site Seminar). All Prince & Prince reports are on the P&P web site: www.FloralMarketResearch.com
About the Prince & Prince Consumer Floral Seminar The market information in this report was obtained from the updated Prince & Prince (P&P) Consumer Floral Seminar, "The U.S. Consumer Floral Tracking Survey, 2014 Edition", which P&P now offers to members of the floral industry and allied trade. Smithers-Oasis North America (SONA) was the key sponsor for the 2014 P&P consumer floral research, and SONA requests attendance at P&P seminars presented in the first-half of 2015. The one-day (or half-day) on-site seminar covers consumer floral purchasing trends on over 100 metrics prior to the U.S. recession (2007), after the recession (2010), and into the recovery period (2013). The seminar reveals numerous "stories" about emerging U.S. floral-market trends, product purchasing trends, consumer priorities in floral purchasing, the changing floral channels of distribution, consumer satisfaction/ dissatisfaction with floral purchases made at the various channels, and the opportunities and challenges that are currently unfolding for the U.S. floral industry. Contact P&P for seminar content, seminar fees, and scheduling.Methods & Definitions Used by Prince & Prince The P&P consumer survey obtains a large random sample of floral-buying households in the U.S. (over 6,000 households randomly-selected over the past five survey periods). n the combined mail and web-based survey, P&P measures the household incidence of floral purchasing for 24 holidays, occasions, and events (among 80 other metrics), including those floral purchases made specifically for Valentine’s Day. P&P defines floral purchasing as the purchasing of fresh cut flowers (arrangements, bouquets, roses, bunches, "stems-to-arrange" (do-it-yourself), and corsages) and/or indoor fresh potted plants (flowering plants, foliage plants, and dish gardens/planters), not outdoor bedding/ garden plants or perennials. By household purchasing incidence, P&P means the purchase of one or more floral products by the household for Valentine’s Day during the study year. P&P shows the purchasing incidence as the percentage of floral-buying households that made a floral purchase for Valentine’s Day for the specific survey years. About the Authors Drs. Tom and Tim Prince, formerly of The Ohio State University, are brothers and co-founders of Prince & Prince, Inc. (P&P), a leading marketing research specialist in the floral and green plant industries. P&P has completed more than 50 major marketing research projects and countless reports for the floral industry in the U.S., and has also conducted research in Canada, the United Kingdom, Holland, Germany, and Spain. P&P conceptualize, design, and implement market research projects and product tests for floral and green-plant suppliers, hardgood suppliers, floral importers, wholesale florists, retail florists, floral-industry associations, and companies serving the allied floral trade. For more information about P&P marketing research and services, and their informative on-site seminars, visit the Prince & Prince web site at www.FloralMarketResearch.com , or contact Prince & Prince below. Prince & Prince, Inc. PO Box 2465, Columbus, OH 43216-2465 Mobile: 614-264-0939 Email: 2640939@gmail.com
|