|
P&P Market Report
Florist Shop Adoption of Communication Modes as Drivers to Florist Business Success: Comparison of 2005 vs. 2011 SEM Model Results Insight
from the Prince & Prince U.S. Retail Florist Tracking Survey
Dr. Thomas L. Prince Dr. Timothy A. Prince Prince & Prince, Inc. Columbus, OH USA
Release Date: April 10th, 2014
EXECUTIVE
SUMMARY In response to a recent Prince & Prince (P&P) report on florist shop adoption of social media, and other florist communication modes (see “Florists Broadly Adopt Social Media, Payoff Somewhat Nil, Now What?”), P&P was queried whether florist Open House events had previously been such a driver to business success. In this reporting, P&P applies a similar structural equation model (SEM) to year 2005 florist survey data to assess communication drivers to Florist Business Success in that year, and makes comparisons with the latter 2011 SEM model. Model comparisons over time identify salient changes in florist market behavior prior to and after the U.S. recession. In 2005, the florist shop Web Site was the sole communication driver to Florist Business Success, in comparison with Own 800 Number, E-mail Promotions, and Open House events. Thus, Open House events had no significant impact on Florist Business Success in 2005. In 2011, all surveyed communication modes, including Social Media (e.g. Facebook/ Twitter), but excluding Own 800 Number, showed a small, yet statistically significant impact on Florist Business Success. Florists’ success with Web Sites in 2005 may have set high expectations for Social Media later on. Analysis of model correlations among the communication modes over time suggests that E-mail Promotions may have contributed to the success of florist Open House events in 2011, especially for the largest-sized florist shops. Historical comparisons of the factor structure of “Florist Business Success” reveals that the florist market perception of “success” likely changed before and after the U.S. recession, with florist profitability weighted more in its contribution to the factor prior to the recession, and sales growth weighted more after the recession. Factor Analysis (a sub-set of SEM) and the full SEM modeling framework are useful tools for market researchers in revealing how the market (survey respondents) define a particular construct or factor, and how those factors may drive an outcome measure (such as Florist Business Success), which provides valuable information about the “mind-set” of a market and market priorities.
Florist Shop Adoption of Communication Modes as Drivers to Florist Business Success: Comparison
of 2005 vs. 2011 SEM Model Results Insight
from the Prince & Prince U.S. Retail Florist Tracking Survey Drs. Tom & Tim Prince, Prince & Prince, Inc., Columbus, OH,
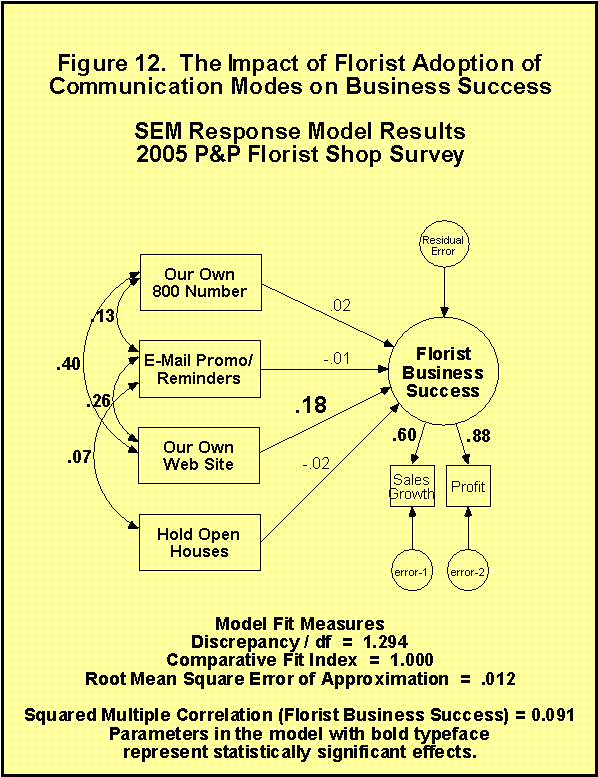
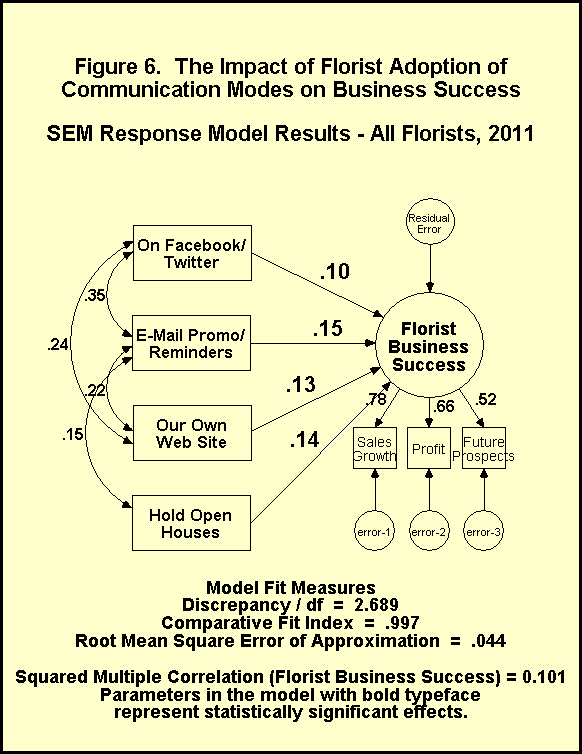
U.S.A. As background to this report, please review the prior report in this series: “Florists Broadly Adopt Social Media . . . Payoff Somewhat Nil . . . Now What?” at the following link: http://www.floralmarketresearch.com/Reports.htm With the recent release of the Prince & Prince (P&P) report about florist shop adoption of social media and other florist communication modes, and their individual impact on florist business success, P&P was queried whether florist Open House events had previously been such a driver to business success (see prior report for details). Given that the P&P florist databases comprise large, national random samples of florist shop survey data over time (e.g. 1998, 2003, 2005, and 2011), P&P has the ability to answer those types of questions (Prince & Prince, 2011). Below is the structural equation model (SEM; Joreskog et al, 1972; Byrne, 2001; Wothke, 2010) graphic for the P&P florist "Communication Modes" model that was applied to the earlier 2005 florist survey data, comprising survey responses from 1,048 randomly-selected florist shops throughout the U.S. (see Figure 12, below). Note that the structure of this SEM model is slightly different than the later model (2011 SEM model; see Figure 6 from the prior report, also below). In the 2005 P&P florist research, P&P did not measure florist shop adoption of Social Media (MySpace and Facebook were initiated in 2003 and 2004, respectively), and there was no measurement of “florists’ future prospects” either. Thus, for the 2005 model, the Florist Business Success factor is measured by only two attributes (year over year sales growth percentage and annual profitability percentage). Additionally, to keep the structural “size” of the 2005 model similar to the 2011 model, P&P added “Our Own 800 Number” as a communication mode to the model, since Social Media was not measured (note that P&P had dropped the 800 Number from the 2011 model since it had no impact on Florist Business Success in preliminary model testing).
In Figure 12, the model-fit measures show that the model fits the 2005 florist survey data quite well (see prior report for interpretations of model-fit measures). The SEM model results for the driver parameters reveal that in 2005, the florist Web Site was the only significant communication driver to Florist Business Success (of the four communication modes), with a positive driver parameter of 0.18, somewhat stronger than in the 2011 model (0.13). The other three communication modes, including Open House events, were not significant drivers to Florist Business Success in 2005 [1]. In comparison, for 2011 (Figure 6), all four modes of florist communication yielded a small, yet statistically significant positive impact on Florist Business Success for the market overall. To summarize, in 2005, of the four florist communication modes, the florist Web Site (which was broadly adopted at the time) was the sole communication driver to Florist Business Success. This fact may partially explain why florists broadly adopted social media in the following 2011 survey, as florists attempted to catch the next “technological wave” to business success. And the prior Web Site experience may have conditioned many florists to expect some success, thus likely setting expectations higher for social media. One aspect of the historical SEM models worthy of noting is the correlations (associations) among the florist communication modes, denoted by double-headed arrows in the models. Note that the correlation between E-mail Promotions and Open Houses was low in 2005 (0.07, Figure 12), likely due to the fact that only a small number of florist shops were involved with e-mail (only 13% in 2005, but 28% in 2011). Also note that in 2005, Open Houses had no significant impact on Florist Business Success. In the latter model (2011, Figure 6), and especially for the largest-sized florists, Open Houses was a relatively stronger driver to florist success (0.27 for the largest-sized florists; see Figure 9 in prior report), and the correlation between Open Houses and E-mail Promotion was also larger (0.22 for the largest-sized florists). Comparing these model findings over time suggests that while E-mail Promotion had no direct positive impact on Florist Business Success in 2011 for the largest-sized florists, at least it may be “partially responsible” for the success of Open Houses in 2011. In light of these historical model findings, tempering investment in E-mail Promotions tied to Open House events may be an un-wise strategy. Another interesting observation that can be made between the 2005 and 2011 SEM models is with the Florist Business Success factor. Back in 2005, when the U.S. economy was “humming along”, the Florist Business Success factor was somewhat more weighted by profitability, with a loading of 0.88, compared to sales growth, with a loading of 0.60 [2]. However, in the 2011 model, with the U.S. economy still recovering from the 2008 recession, and with much industry focus on generating sales, sales growth had the somewhat larger loading on the Florist Business Success factor (0.78; Figure 6), compared to the profitability loading (0.66). In effect, the factor loadings (weightings) “flipped”, profitability weighted more prior to the recession, and sales growth weighted more after the recession. Thus, the florist market perception of “success” changed somewhat before and after the recession. P&P has used Factor Analysis and SEM modeling extensively in their market research projects for the floral industry, since this author's initial publication utilizing the market research technique back in 1991 (Prince et al, 1991). P&P often find the factor analysis of market survey data, either Exploratory Factor Analysis (EFA), or Confirmatory Factor Analysis (CFA), as in the SEM models (Factor Analysis is a “sub-set” of the SEM model framework), to be especially helpful in understanding how the market defines or perceives constructs (factors), such as business success, or product quality, or salesforce performance, or value, etc. At the P&P seminars, it is interesting to discuss with clients the survey attributes and the weightings (loadings) of those attributes for a particular factor - - describing how the market defines the factor, and thus, gaining a better understanding of the “mind-set” of the market. Although these market definitions/ perceptions may change somewhat from market to market, and over time, there are few other market research technologies that offer this type of insight with market survey data. Extending to the full SEM model framework, where attributes and factors may also drive “outcome factors” (such as Florist Business Success, or Consumer Satisfaction/ Outlet Purchasing Loyalty, as in P&P’s consumer floral seminar), the identification of key drivers or market priorities can readily be assessed. And several P&P clients have used this market definition/ perceptual insight and identification of market priorities to their advantage in their marketing and business strategies. If readers wish to comment on this report, please e-mail Tom Prince at the P&P e-mail address: 2640939@gmail.com Byrne, B.M. (2001). Structural Equation Modeling With AMOS, Basic Concepts, Applications, and Programming. Mahwah, NJ: Lawrence Erlbaum Associates. Joreskog,
K.G.; Van Thillo, M. (1972). "LISREL: A General Computer
Program for Estimating a Linear Structural Equation System Involving
Multiple Indicators of Unmeasured Variables (RB-72-56)."
Princeton, NJ: Educational Testing Service.
Prince, T.L., H.K. Tayama, and J.R. Grabner, Jr. (1991). Description of florists' cognitive structure and perceived performance of supplier services through second-order factor analysis. J. Amer. Hort. Sci. 116(1):161-165. Prince, T.L., and T.A. Prince (2011). The Prince & Prince U.S. Retail Florist Tracking Survey, 2011 Edition (On-Site Seminar and CD). Columbus, OH: Prince & Prince, Inc. Wothke, W. (2010). Introduction to Structural Equation Modeling Course Notes. Cary, NC: SAS Institute Inc.
[1] In
2005, 60% of florist shops had their Own Web Site, 34% held Open
House events, 72% had their Own 800 Number, and 13% were
involved with E-mail Promotions. Source: The Prince & Prince U.S. Retail Florist
Tracking Survey, 2011 Edition. [2] The
loadings may obtain
a value between 0 (no association) and 1.0 (perfect positive
association), or –1.0 (perfect negative association) with
higher loadings representing greater association between the
measured attributes (e.g. sales growth, profitability, etc.) and
the factor (e.g. Florist Business Success).
In general, loadings in the 0.8 to 0.9 range or higher
represent “excellent” association with the factor, those in
the 0.6 to 0.7 range represent “good” association, those in
the 0.4 to 0.5 range represent “fair” association, and
loadings lower than 0.4 represent “weak” association.
|
|
Prince & Prince, Inc. PO Box 2465, Columbus, OH 43216-2465 Mobile: 614-264-0939 Email: 2640939@gmail.com
|


