
FloralMarketResearch.com - - The site for Floral Marketing Research
From the Prince & Prince Research Article Archive
Profiling Sales Growth of Perennial Plant Growers
Featured in "Market Watch" of the Feb. 2003 edition of Greenhouse Grower
Note: This article is based on market research conducted by Prince & Prince, Inc. We sincerely thank the 800+ perennial plant growers who participated in this marketing research, which made this reporting possible.
Drs. Tom & Tim Prince, Prince & Prince, Inc., Columbus, Ohio
Through its market studies of the floral and green plant industries, Prince & Prince is able to assess the pulse and vitality of the horticultural marketplace. In this reporting, we highlight recent survey statistics of sales growth for perennial plant growers nationwide as a benchmark for the perennial plant industry. This report profiles national year over year sales growth statistics of perennial plant growers for 2001, and also reveals how these growth patterns vary by three business characteristics. Overall, the 2001 statistical profile indicates healthy growth in the perennial plant industry, with about one-half of growers nationwide reporting moderate to high growth in perennial plant sales, and less than 10% reporting sales declines.
The Market Survey
The market data for this reporting was obtained from an Autumn 2001 Prince & Prince survey of randomly-selected perennial plant growers throughout the US. Over 800 perennial plant growers responded to the mailed questionnaire, representing nearly $163 million in annual perennial plant production sales (wholesale value). The survey was part of an extensive evaluation of the perennial plant grower industry, covering grower production trends and grower/plant-supplier relationships. In part of the survey, 826 grower respondents indicated the percentage level of sales growth of their perennial plant sales over the past year, as well as descriptive characteristics of their business (e.g. level of perennial sales, region, number of years producing perennials, etc.). In the survey, we categorized perennial plant sales growth into six categories: 1) sales declines over 15%, 2) sales declines of 6 to 15%, 3) stable sales (plus or minus 5%), 4) sales growth of 6 to 15%, 5) sales growth of 16 to 25%, and 6) sales growth over 25%. Compilation and analysis of this survey data provides a sales growth profile for the perennial plant industry.
2001 Perennial Plant Growth Profile
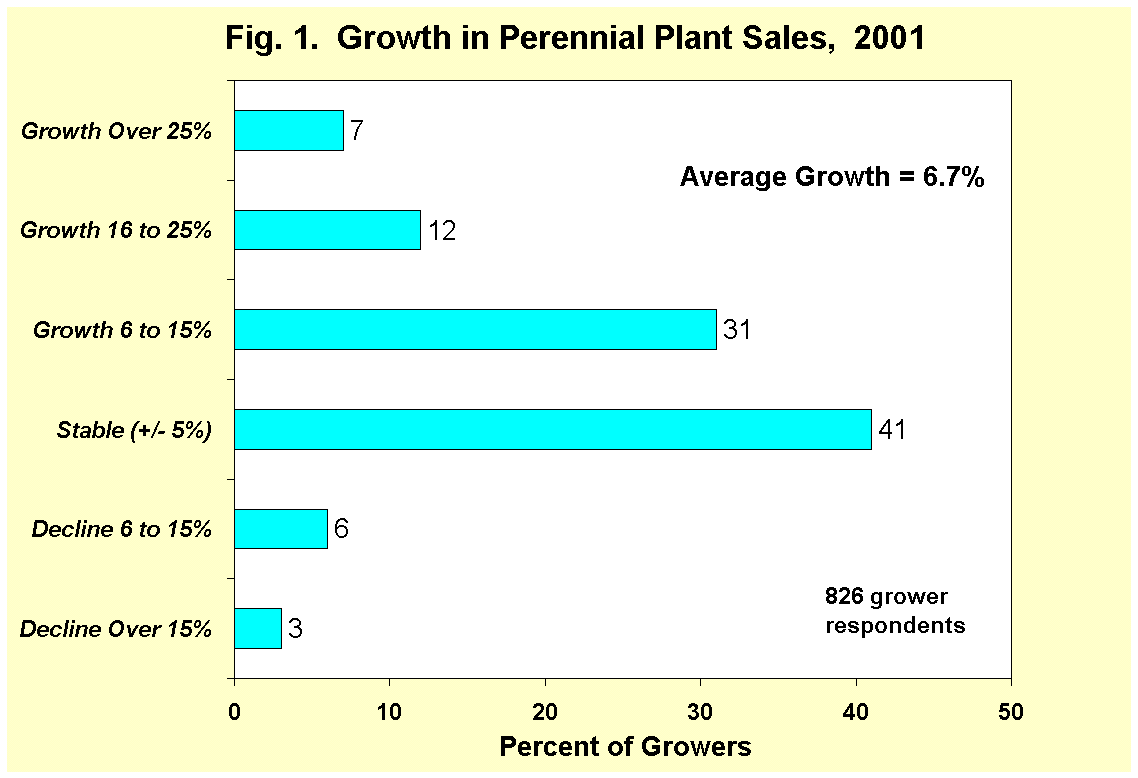
Figure 1 shows the profile of sales growth in perennial plants for the 2001 season. About 50% of perennial plant growers nationwide indicated growth in perennial plant sales, about 40% witnessed stable sales, and less than 10% of growers indicated sales declines over the previous year. For those growers experiencing sales growth, most witnessed growth of 6% to 15%, while 12% of growers witnessed higher growth of 16% to 25%, and 7% witnessed extensive sales growth over 25%. Overall, sales growth in perennial plants averaged 6.7% nationwide in 2001.
Growth by Level of Perennial Production Sales
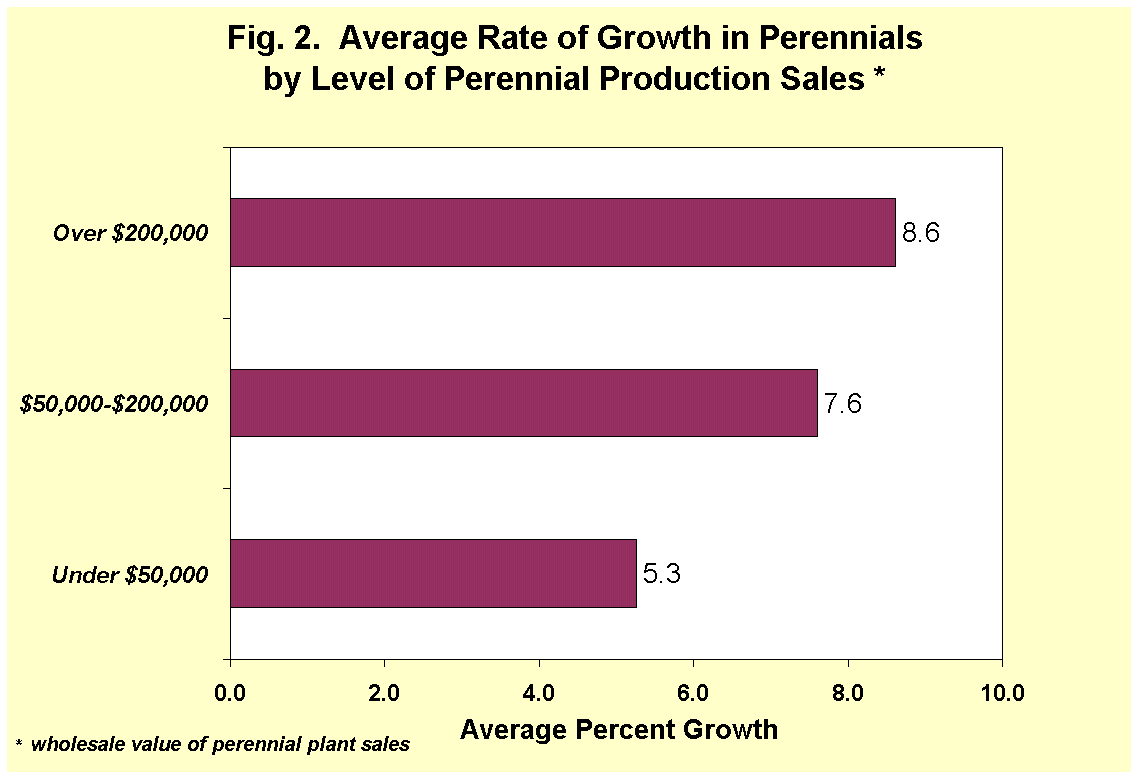
Part of the survey assessed the growers’ annual perennial plant production sales (wholesale value). We grouped the growers’ annual perennial plant production sales into three categories: 1) Under $50,000, 2)$50,000 - $200,000, and 3) Over $200,000. Figure 2 shows the growers’ perennial plant growth profile across the three sales categories.
A clear trend across the sales categories is that larger-sized perennial plant growers generally witnessed higher growth in perennial plant sales for the 2001 season. Those growers in the smallest-sized sales category (< $50,000) registered average annual sales growth around 5%, whereas the largest sized perennial plant growers (> $200,000) registered average annual sales growth topping 8.5%. Collectively, these national growth statistic are indicative of a healthy perennial plant industry.
Sales Growth by Region
While the national statistics provide an overall aggregate view of perennial plant sales growth, a regional profile reveals some of the dynamics in the perennial plant industry. Table 1 shows the average rate of sales growth for perennial plant growers in the five US Census regions, and also shows this regional growth segmented by level of perennial production sales. The five Census regions are identified by the following states: West (AK, AZ, CA, CO, HI, ID, MT, NM, NV, OR, UT, WA, WY), Midwest (IA, IL, IN, KS, MI, MO, MN, NE, ND, OH, SD, WI), South Central (AL, AR, KY, LA, MS, OK, TN, TX), South Atlantic (DC, DE, FL, GA, MD, NC, SC, VA, WV), and Northeast (CT, MA, ME, NH, NJ, NY, PA, RI, VT).
Perennial plant growers in the Northeast and West regions witnessed the highest average rate of growth for 2001 (over 8% growth), followed by growers in the Southeast, with about 7% average growth. Perennial plant growers in the Mid-West and South Central regions registered somewhat lower rates of growth, averaging 4.8% and 5.8%, respectively. The regional growth statistics segmented by level of perennial sales reveal that for most regions of the U.S., growers with a higher level of perennial plant sales showed higher levels of growth, especially growers in the West and South Central regions. However, the segmented growth statistics for the Mid-West region showed relatively lower growth for growers in the largest-sized sales category (counter to the national grower trend). This suggests that while perennial plant sales growth is healthy in the Mid-West region, the potential for higher growth in perennials may be "topping out" in this region.
Sales Growth by Number of Years Growing Perennials
The survey also assessed the number of years that the grower had been involved in producing perennial plants to assess growth characteristics for various experience groups. We categorized the growers’ years of experience in producing perennial plants into 5 categories: 1) 1-4 years, 2) 5-7 years, 3) 8-10 years, 4) 11-20 years, and 5) over 20 years. Table 2 shows the growers’ perennial plant growth profile across the five experience groups, and also shows this growth profile segmented by level of perennial production sales.
Across the experience groups, growers’ perennial plant sales growth is generally highest for the most recent entrants into perennial plant production, and lowest for those growers with over two decades of experience in growing perennials. In fact, those growers producing perennials for 4 years or less showed double-digit average sales growth for the 2001 season. For those growing perennials 7 years or less, sales growth was fairly consistent across the perennial sales categories. However, for those growing perennials 8 to 20 years, higher sales growth was associated with higher levels of perennial plant sales. But this sales growth trend does not continue for those growing perennials for more than 20 years. This most-experienced group of perennial plant growers reveals some limitations in sales growth at the highest sales category, registering less than 3% average sales growth.
Summary
The sales growth patterns shown in this report may be used by perennial plant growers as key benchmarks for comparison with their own production operations. The overall growth trends reveal that the perennial plant industry in the US is experiencing healthy sales growth. The segmented growth statistics reveal that growers with higher levels of perennial plant sales are leading the sales growth trends. While the Mid-West region may show some limitations on growth potentials, the larger growers in the West and South Central regions are driving double-digit sales gains. Moreover, recent entrants into perennial plant production over the past 7 years are forging the higher sales growth patterns for this industry.


|
Table 1. Growth in Perennial Sales Across Region and Perennial Sales Groups |
|
|||
|
|
Perennial Sales Groups |
|||
|
|
Under $50,000 |
$50,000-$200,000 |
Over $200,000 |
Overall Mean* |
|
|
% Growth in Sales |
|||
|
Northeast |
7.0 |
10.3 |
9.1 |
8.4 |
|
Mid-West * |
2.9 |
6.7 |
4.7 |
4.8 |
|
Southeast |
6.9 |
6.8 |
9.3 |
7.1 |
|
South Central * |
4.3 |
5.8 |
10.7 |
5.8 |
|
West * |
4.0 |
10.2 |
10.8 |
8.3 |
|
Overall Mean* |
5.3 |
7.6 |
8.6 |
6.7 |
|
|
|
|
|
|
|
* indicates significant difference across groups |
|
|
||
|
Table 2. Growth in Perennial Sales Across Year and Perennial Sales Groups |
|
|||
|
|
Perennial Sales Groups |
|||
|
|
Under $50,000 |
$50,000-$200,000 |
Over $200,000 |
Overall Mean* |
|
Years Growing Perennials |
% Growth in Sales |
|||
|
1-4 |
10.9 |
13.3 |
8.2 |
10.9 |
|
5-7 |
8.1 |
6.4 |
7.8 |
7.4 |
|
8-10 * |
3.6 |
5.7 |
9.9 |
5.4 |
|
11-20 * |
3.7 |
7.0 |
10.5 |
6.3 |
|
Over 20 * |
-0.9 |
8.1 |
2.7 |
3.2 |
|
Overall Mean* |
5.3 |
7.6 |
8.6 |
6.7 |
|
|
|
|
|
|
|
* indicates significant difference across groups |
|
|
||
About the Authors. Drs. Tom and Tim Prince, formerly of The Ohio State University, are brothers and co-founders of Prince & Prince, Inc., a leading marketing research specialist in the floral and green plant industries. Prince & Prince has completed more than 50 major marketing research reports for the floral and floral-related industries in the US, and has also conducted floral marketing research in Canada, the United Kingdom, Holland, and Germany. They conceptualize and implement market studies and product tests for floral and green-plant suppliers, floral importers, wholesale florists, retail florists, and floral-industry associations. For more information about their marketing research, visit their web site at www.FloralMarketResearch.com.
|
Prince & Prince, Inc., 331 W. 4th Ave., Columbus, OH 43201 Mobile: 614-264-0939 Email: 2640939@gmail.com
|
Copyright
© 2025 by Prince & Prince, Inc.
All rights reserved.